
 Canada (English)
Choose country and language
Canada (English)
Choose country and language
In modern digital farming, most field mapping on the market brings improved analysis of a farmer’s fields in order to create management zones that establish field variabilities and the status of your crop. In order to paint an even more specific user-centric picture, xarvio has implemented Biomass Maps for use with its FIELD MANAGER application for exact seasonal input that supports farmers with cross-field and field history comparability to enable a consistent monitoring of their fields.
In modern digital farming, most field mapping on the market brings improved analysis of a farmer’s fields in order to create management zones that establish field variabilities and the status of your crop. In order to paint an even more specific user-centric picture, xarvio has implemented Biomass Maps for use with its FIELD MANAGER application for exact seasonal input that supports farmers with cross-field and field history comparability to enable a consistent monitoring of their fields.
The advancements in technology that have allowed for the transformation of agriculture as a whole rely heavily on satellite mapping. xarvio uses multiple sources of satellite image data to frequently cover a farmer’s field within the season. This can be incredibly helpful to overcome the influence of clouds or other types of inclement weather which can diminish the overall picture. That is why multiple input data sources are combined to give an optimal representation of one’s fields. Biomass Maps help eliminate this often-unnoticed discrepancy.
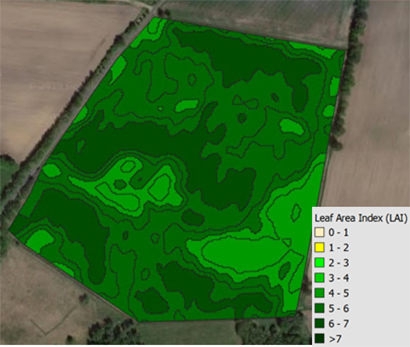 Figure 1: Improved Biomass mapping includes new color scale ranging from bright yellow (low LAI) to dark green (high LAI)
Biomass Maps use the leaf area index (LAI) as a key indicator in measuring the biomass. LAI-based Biomass Maps are capable of showing the biomass within your field at an exact point in time and make it possible to monitor field development seasonally while also comparing fields with each other. Interestingly, Biomass Maps not only show differences in biomass coverage within each field but also the magnitude of the variation in yellow to green colors. The advantage of comparing different fields can be used as an orientation for all applications as well. If, for example, farmers are using xarvio FIELD MANAGER to plan applications in their fields, the added value of the Biomass Map input will allow for adjustments of the dose rates. Furthermore, it will provide the user with the ability to evaluate the effects of previous applications and xarvio FIELD MANAGER to incorporate these outcomes into future application planning.
Farmers know the different management zones within their fields, but without Biomass Maps they may not know the exact influence within the ongoing season and at the specific moment of the planned application. Biomass Maps make visible numerous factors to the overall analysis including the pattern of soil compaction or soil properties that, in turn, influence, i.e., surface moisture. They also show pattern of fertilization, plant growth regulator or plant protection product applications. When planned with xarvio FIELD MANAGER, these patterns are taken into account for future applications.
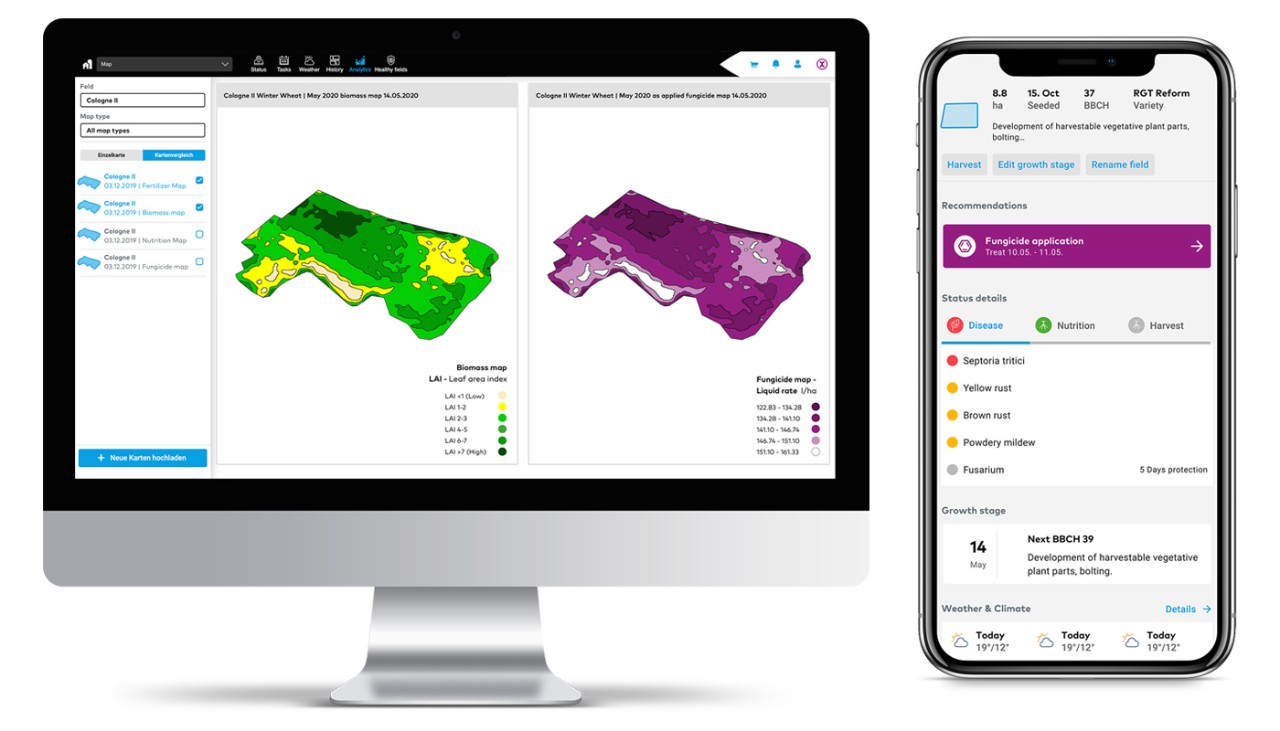
 Figure 3: By incorporating agronomic logic and biomass mapping, a more comprehensive application mapping (see above) is the result.
The purple Application Maps that are based on Biomass Maps and then used in combination with the “Spray Timer” feature within the xarvio FIELD MANAGER can provide the best recommendation for a farmer’s variable rate application for every part of a field. Presently, no other company is able to deliver Biomass Maps with the same frequency, coverage, consistency like xarvio while also offering options to compare fields within the season and across fields.


 Argentina (español)
  Brazil (Portuguese)
  France (Français)
  Germany (Deutsch)
  Global (English)
  Japan (Japanese)
  USA (English)
  Ukraine (Ukrainian)