FIELD MANAGER

Field Monitor

Field Monitor

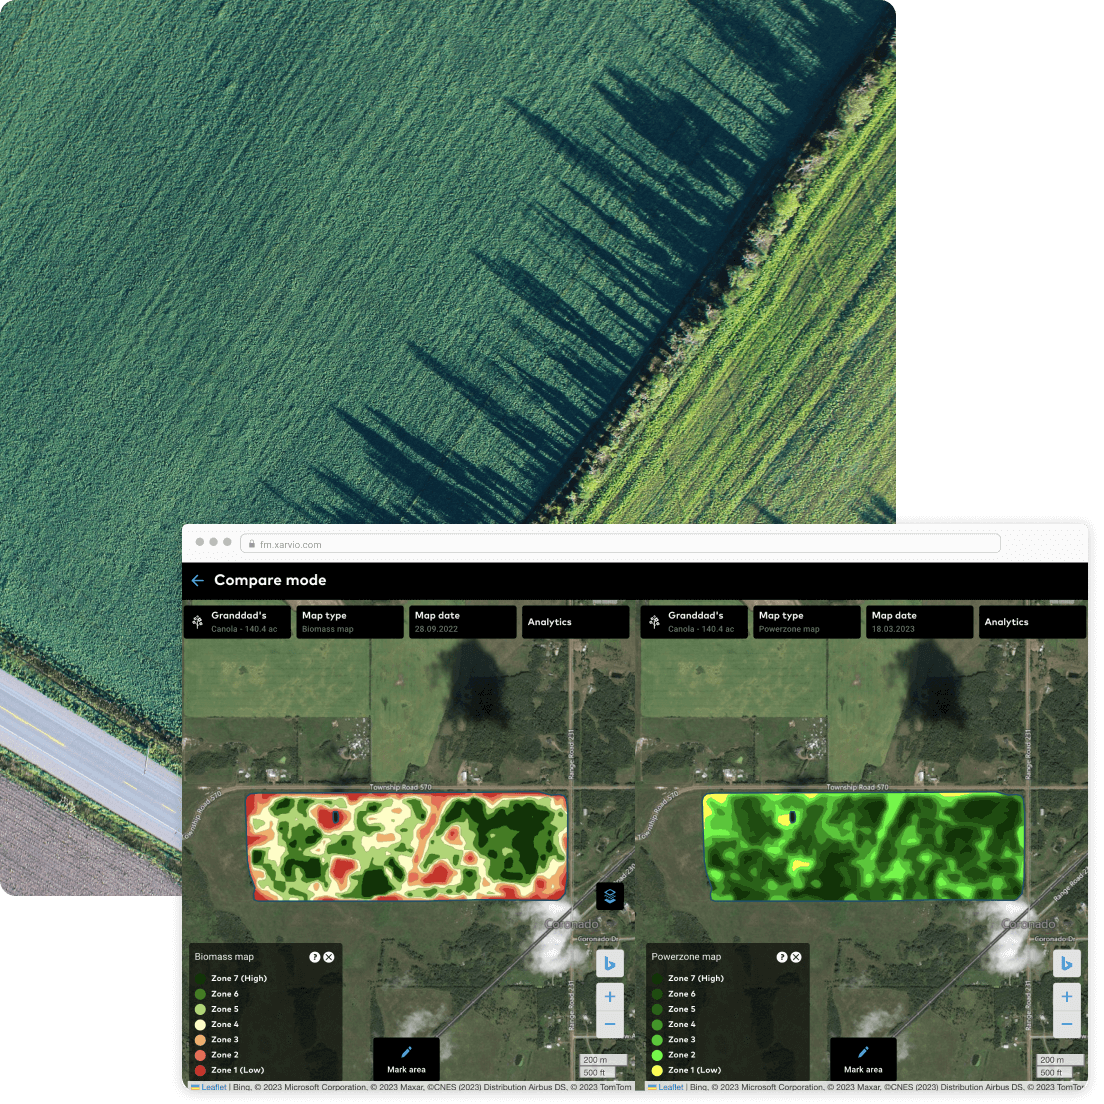
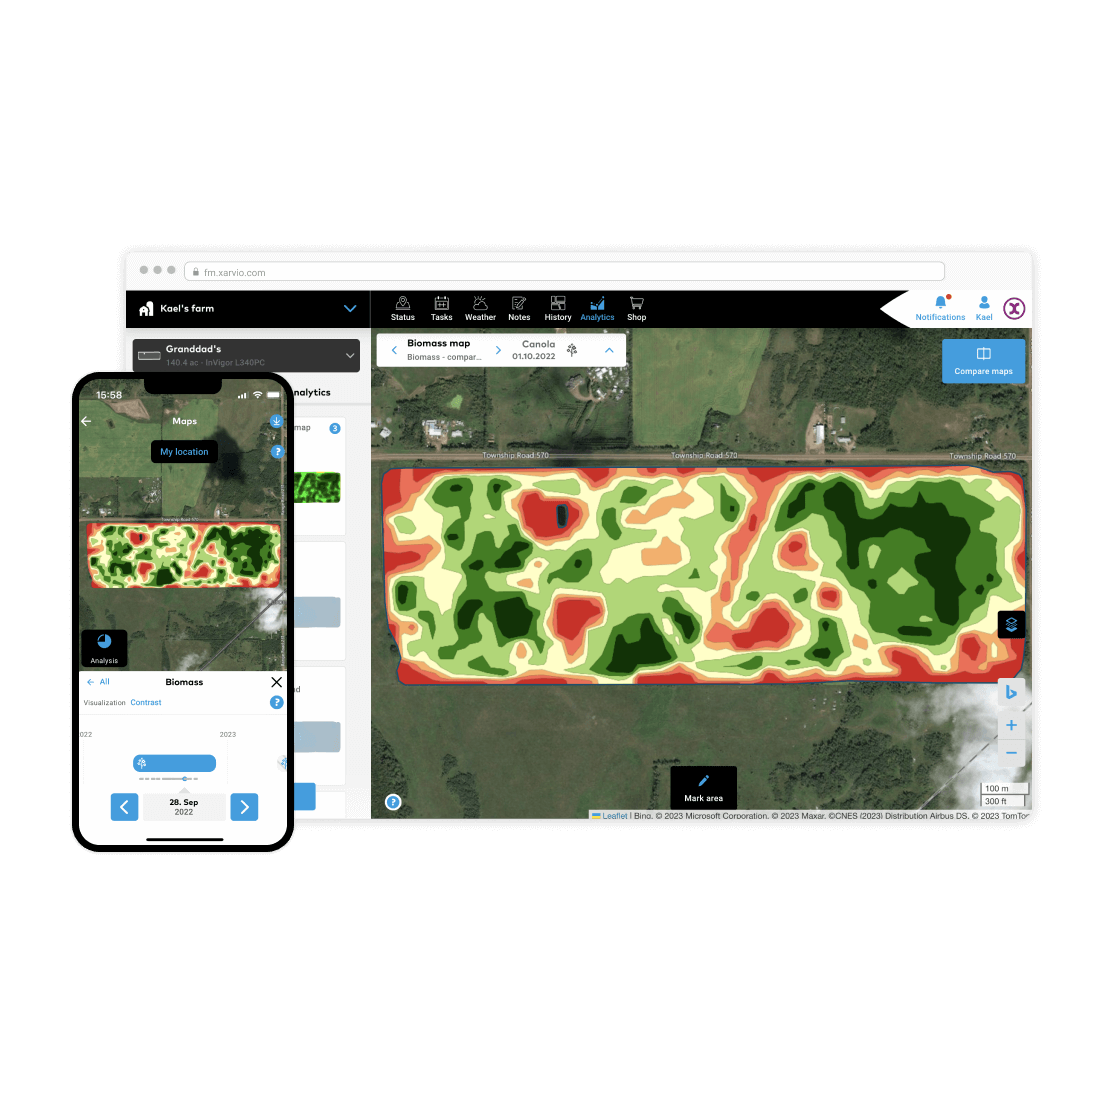
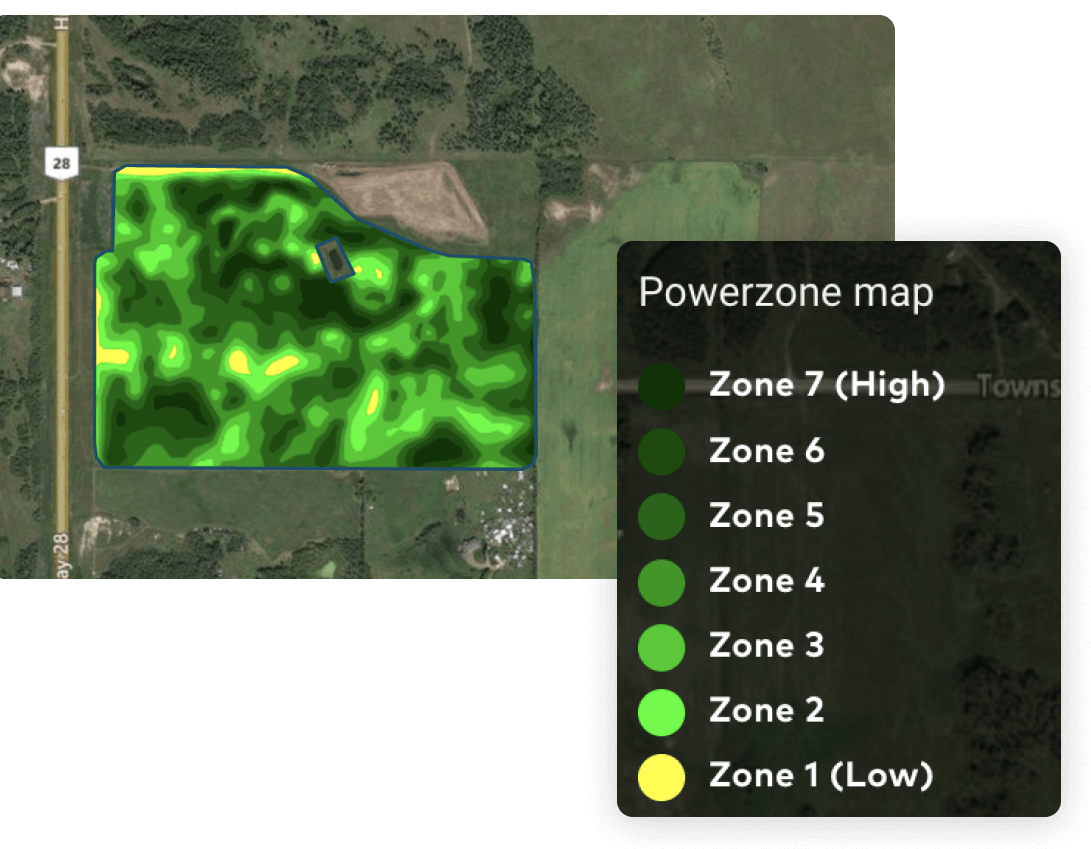
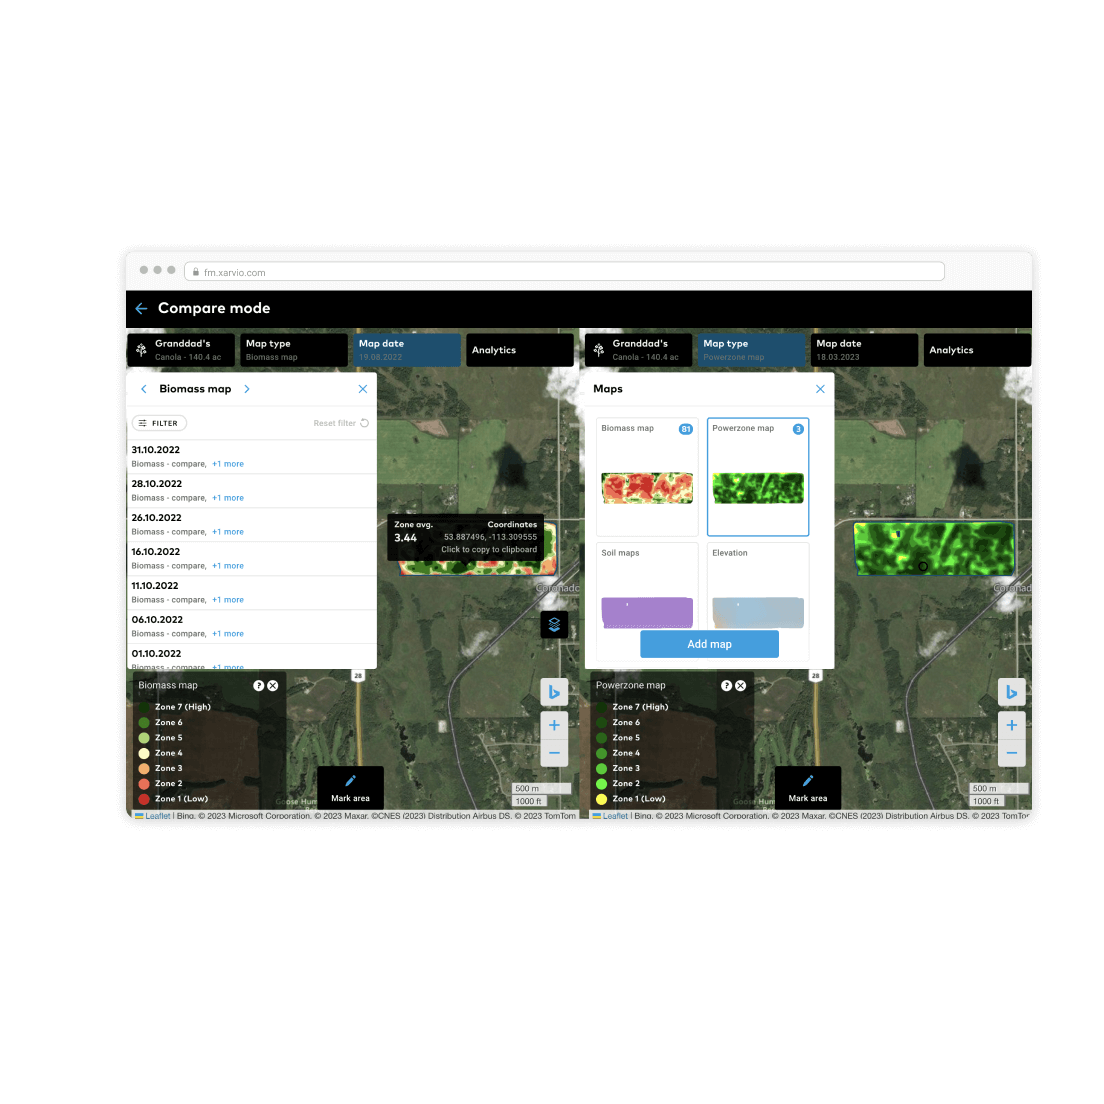
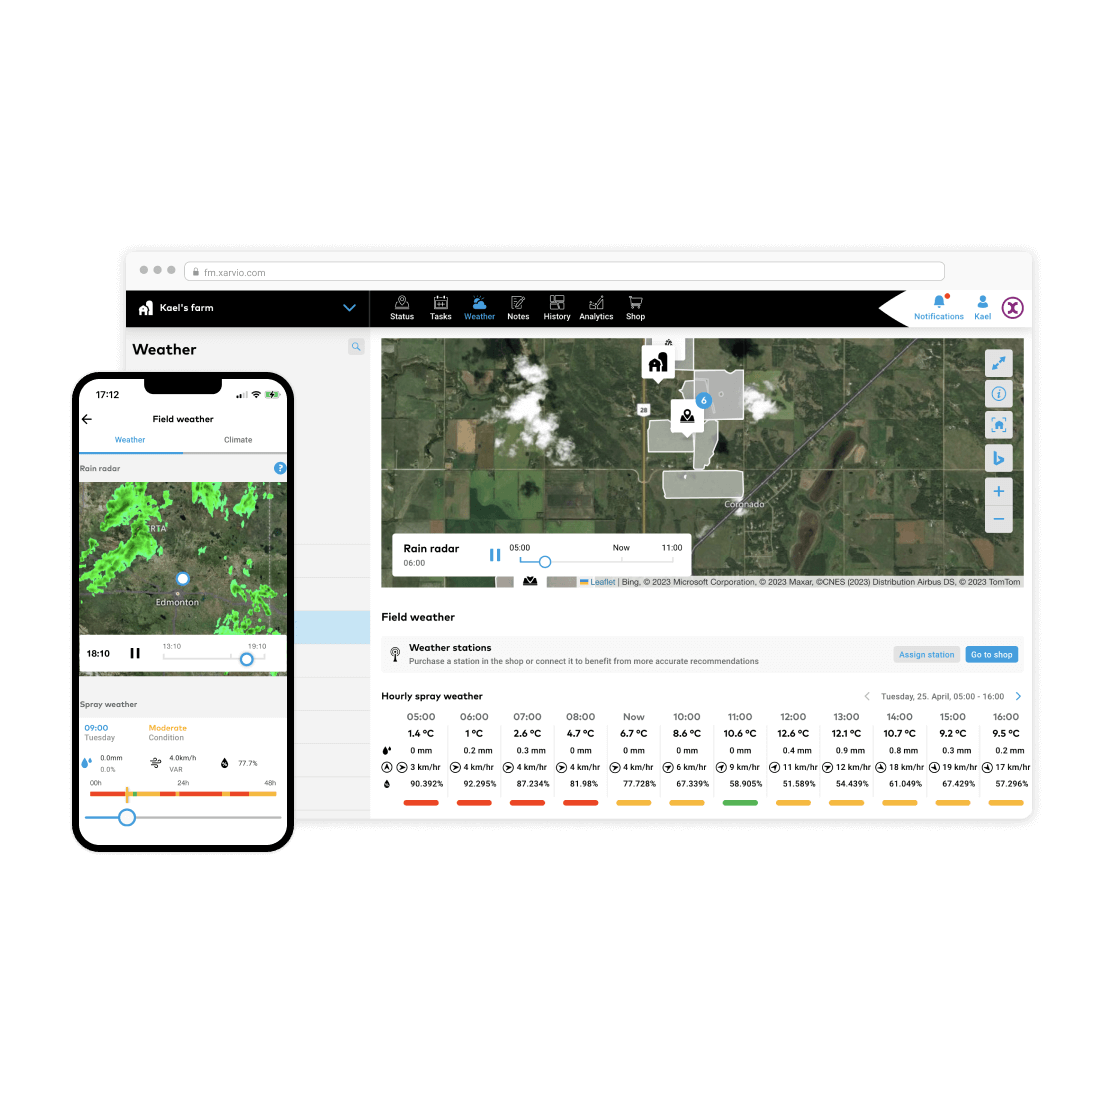
Receive, upload & analyze all field-zone specific information in one place. Increase transparency & make better informed decisions for your fields, all year long.
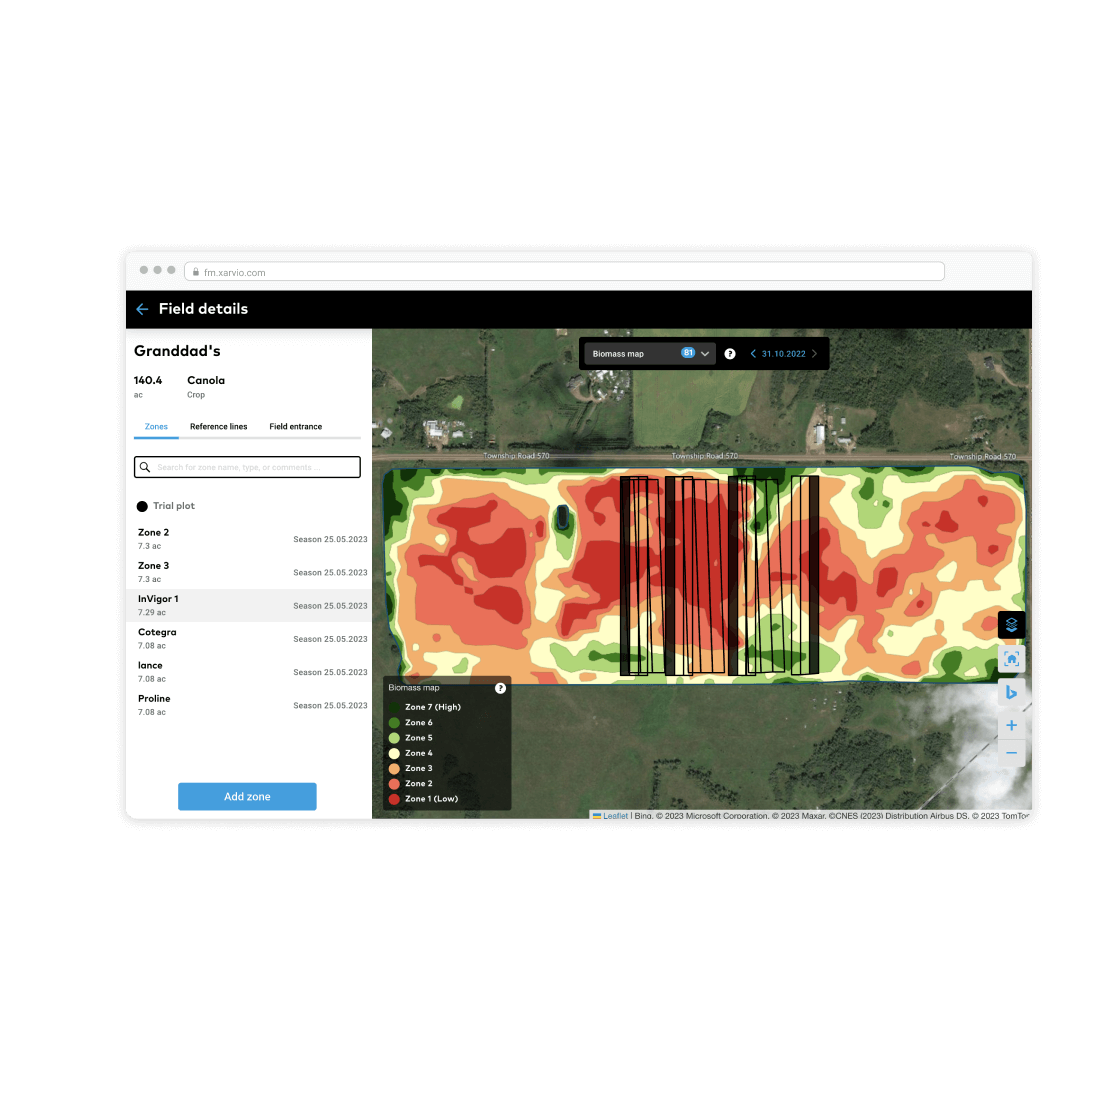
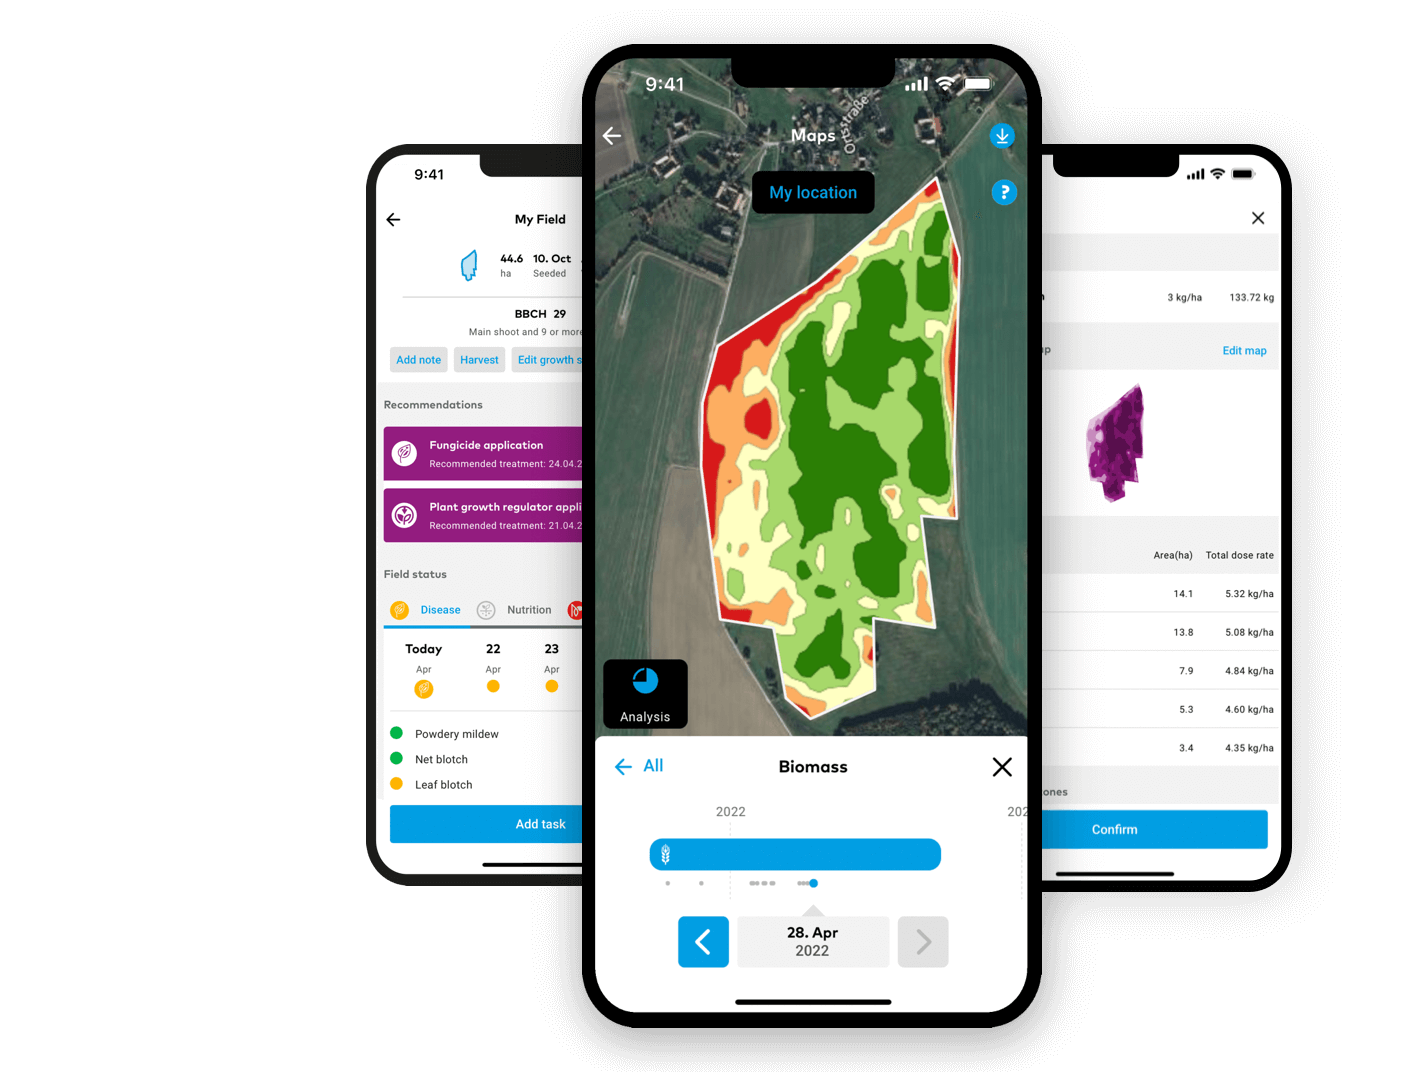
Set-up field management zones; for example, buffer & biodiversity zones, trial plots or field obstacles; according to individual field needs.

Field Monitor

xarvio Field Monitor benefits

Biomass Maps and Satellite Images

Current Biomass Maps 
and Satellite Images

Identify high & low performing field-zones based on current satellite data

  • Compare maps of different fields at any time, including maps from previous years
  • Receive relative biomass maps every three days to visually compare differences in an individual field.
  • Use biomass maps to make better-informed decisions for your crop production.
  • Benefit from updated information on the success of your field management activities.
  • Identify issues in your fields early and prioritize your scouting activities.
Biomass Maps and Satellite Images

Historical yield potential maps

Assess the yield potential for each field zone based on 15 years of historic biomass data

  • Pre-Season: Use the historical biomass maps to plan your seeding and field work
  • In-Season: Utilize historic biomass data for your fertilizer applications
Historical yield potential maps
Management zones

Management zones

Set-up field management zones for individual fields, permanently or season specific.


  • Identify the right place for management zones using different information layers in the background
    • Historic & current biomass
    • Soil maps
    • Yield maps
  • Categorize them and manage them accordingly
    • Buffer & biodiversity zones
    • Trial plots
    • Field obstacles
  • Upload or send the management zone maps to your terminal for automatic in-field implementation
Management zones

Field Analytics

One place to monitor, compare and analyze field zone information all year long.

  • Compare different maps to better understand field characteristics and agronomic potential.
  • Monitor crop performance during and across seasons.
  • Optimize crop production by analyzing the results of different field management strategies.
  • Upload and visualize as-applied and yield maps to analyze application performance and harvest.
  • NEW - Upload and visualize soil maps from your fields to plan targeted actions.
Field Analytics
Field Analytics
Weather Pro

Weather Pro

Detailed in-season weather information.

  • Receive hourly weather forecasts & gain access to historical weather data.
  • Know exactly when the best conditions are for field management activities.
  • Compare in season rainfall & temperatures with averages over the last 10 years.
Weather Pro

Connect your weather station with FIELD MANAGER

Get even more precise weather data & field analysis

  • Visualize individual in-field weather data
  • Receive real-time field weather updates
  • Feed in-field data into xarvio’s agronomic risk models for even better recommendations
Connect your weather station with FIELD MANAGER